Mean vs. Median Penis Size: What the Numbers Actually Tell You
Here’s the number that stops men cold: in the biggest clinician-measured study we’ve got, the average erect penis is 13.12 cm and the median is 13.1 cm. Practically the same number. That isn’t a rounding fluke or a dull footnote — it’s the single most useful fact about how size spreads across the population, and it quietly demolishes most of the scary “average” headlines you’ve ever read. Let’s pull the two numbers apart and show you what each one is really saying.
Mean and median: same word problem, two answers
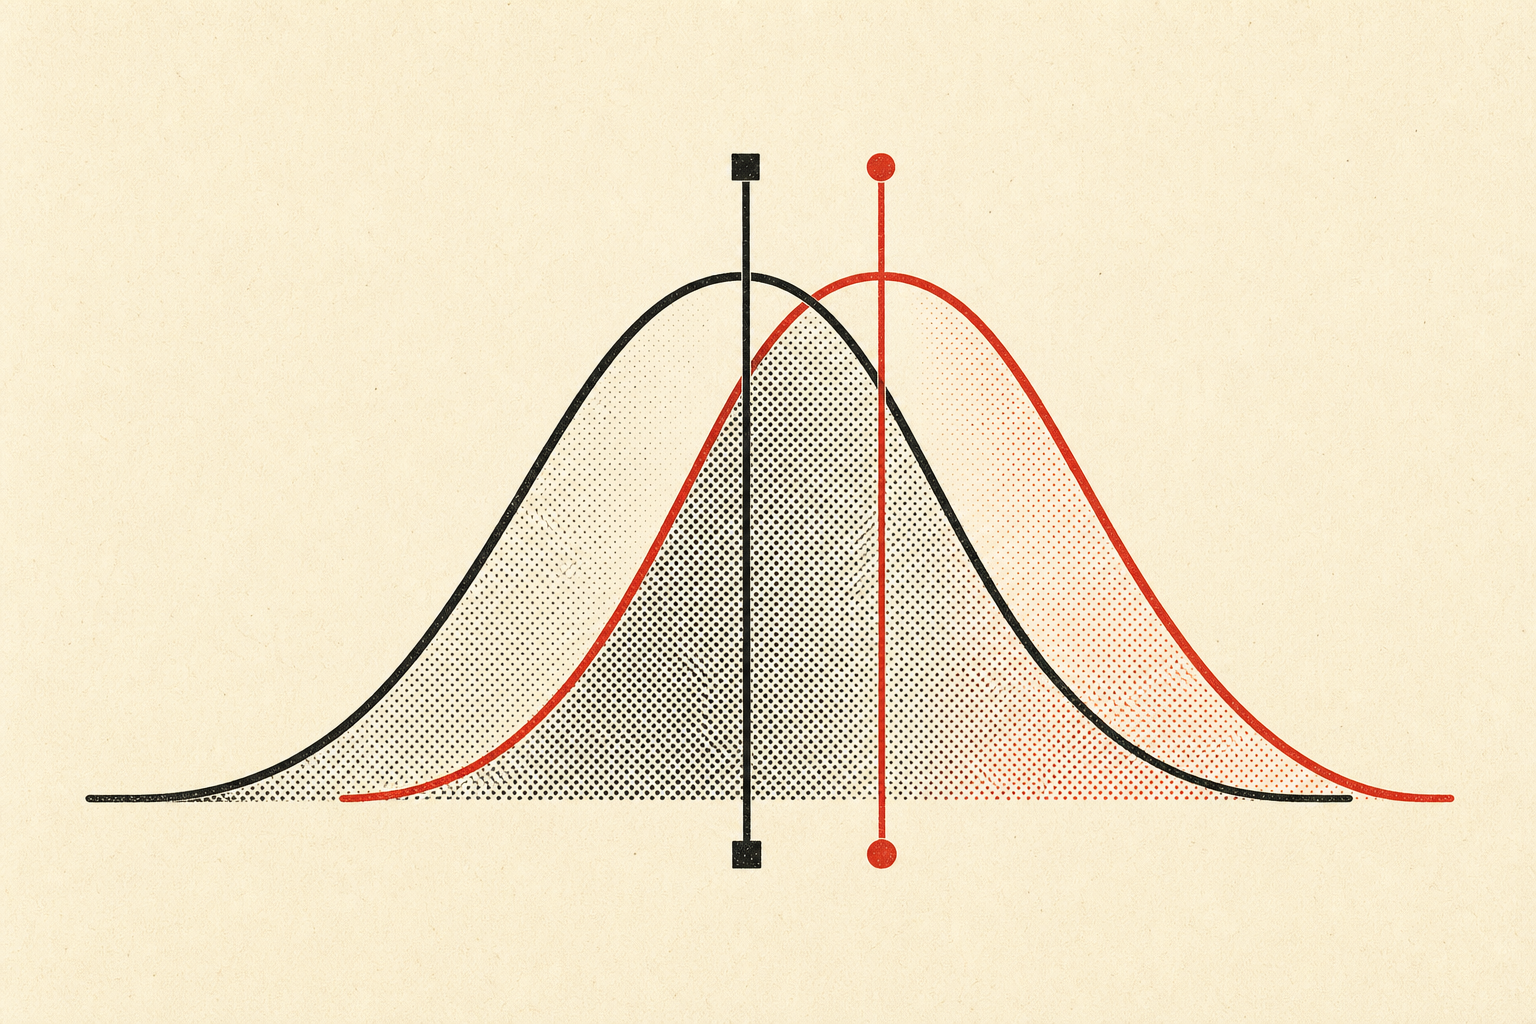
“Average” almost always means the mean: add up every man’s measurement, divide by the number of men. The median is a different beast. Line every man up shortest to tallest and the median is the guy standing dead center. Half the line falls below him, half above.
Those two numbers can drift miles apart. Picture average household income in a town with one resident billionaire. The mean income looks spectacular. The median — the actual middle household — sits way down low, because that one outlier hauls the average up by its bootstraps. Means get yanked around by extremes. Medians don’t flinch; the middle of the line is the middle of the line whether the tallest man is 17 cm or 47 cm.
So when the mean and median land right on top of each other — 13.12 versus 13.1 — the data is telling you something concrete. No freakish tail is dragging things sideways. The distribution is close to symmetric: about as many men sit a given distance below the middle as sit that same distance above. Which brings us to the bell.
The bell curve, and why “average” gets misread
Penis size follows a roughly normal distribution — the classic bell curve. Most men cluster near the middle, and the further you travel from center in either direction, the fewer men you find. The numbers from Veale et al. 2015 (n=15,521, all clinician-measured) draw that bell cleanly:
- 5th percentile: 10.4 cm (4.1 in)
- 25th percentile: 12.0 cm (4.7 in)
- 50th / median: 13.1 cm (5.2 in)
- 75th percentile: 14.2 cm (5.6 in)
- 95th percentile: 15.9 cm (6.2 in)
Look how tight that is. Go from the 25th percentile to the 75th — the entire middle half of men — and you’ve moved barely 2 cm. The bulge of the bell is narrow.
Here’s where “average” gets butchered. Men hear “the average is 13.12 cm” and instantly translate it to “13.12 is the bar, and falling under it means falling behind.” Wrong. Average isn’t a passing grade. By definition, a huge share of men sit below the mean and are completely, statistically ordinary. There’s no failing on a bell curve. There’s only where you land on it — and the overwhelming majority of the curve is unremarkable in the most literal sense: it does not remark. Want to know exactly where any measurement lands? The percentile calculator does the placing for you.
What a percentile actually means (and what it doesn’t)
A percentile answers one question: what fraction of men measure at or below this size? The 90th percentile (15.2 cm / 6.0 in) means 90% of men land at or under it, and roughly 10% sit above — about 1 in 10.
Read that direction carefully, because it flips locker-room intuition on its head. Six inches erect feels average in the mythology, but it’s the 90th percentile. A man at exactly six inches is bigger than nine out of ten men. The “everyone’s packing six-plus” story is, statistically, pure fiction.
Plot a few more landmarks and the map snaps into focus:
- 4 inches lands around the 4th percentile — small, but firmly inside the normal range, not a medical category.
- 5 inches is roughly the 40th percentile — squarely, boringly typical. (We wrote a whole piece on why 5 inches is normal, because the question never stops coming.)
- 5.5 inches is about the 70th percentile.
- 6 inches is ~90th — that 1-in-10 figure again.
- 7 inches sits near the 99.7th percentile: about 1 in 400.
- 8 inches is rarer than 1 in 10,000.
That last stretch is the whole point. The bell’s tail thins out fast. The jump from 6 to 7 inches isn’t one notch up — it’s the gulf between 1-in-10 and 1-in-400. Sizes that pornography and bravado peddle as a baseline are, in the real population, genuinely rare. Curious exactly how rare yours is? How rare is my size runs the math. And if you’d rather see the curve as a picture than a list, how big is big renders the whole thing.
The 90% band: where almost everyone lives
Stack the 5th and 95th percentiles together and you get one flat-out reassuring fact: about 90% of men have an erect length between 10.4 cm and 15.9 cm (4.1 to 6.2 inches). Nine out of ten men live inside a 5.5 cm window. That’s the normal range — not a target, a range — and it’s where the conversation should start and almost always end.
The same study fills in the rest of the dimensions, and they cluster just as tightly:
- Average erect girth: 11.66 cm (4.59 in)
- Average flaccid length: 9.16 cm (3.6 in)
- Average stretched length: 13.24 cm (5.21 in)
- Average erect volume: ~142 ml
Flaccid is the least informative number of the bunch. The resting state swings wildly with temperature, mood, and whether a man is a grower or a shower, and it predicts erect size poorly. If your soft and hard measurements seem mismatched, that’s normal variation, not a defect — the grower vs shower tool and our flaccid vs erect breakdown explain why. Full percentile tables for every dimension live on the penis size statistics page.
Bone-pressed vs not: the gotcha that fakes 2 cm
Before you stack yourself against any of these numbers, nail down how they were measured — because this is exactly where men accidentally short-change themselves or pad the chart.
Research like Veale’s measures bone-pressed (BPEL): the ruler is pushed firmly in at the base until it meets the pubic bone, compressing the fat pad. That’s the standard, for a good reason. The fat pad varies between men; the bone doesn’t. So bone-pressed gives a stable, comparable baseline.
Measure yourself the casual way — ruler resting on top of the fat pad, non-bone-pressed (NBPEL) — and you’ll read roughly 1 to 2 cm shorter, depending on your pad. A man comparing his living-room NBPEL number against a clinic’s BPEL chart is comparing apples to slightly-compressed oranges, then declaring himself below average when he isn’t. Girth, mercifully, is immune to all of this. Our how to measure guide walks through doing it consistently, and the methodology page documents exactly which convention each statistic uses.
What partners actually report wanting
Numbers on a chart are one thing; what lands with a partner is another, and the research here is far calmer than the anxiety screaming in your head. In Prause’s 2015 study, women selecting from 3D-printed models picked around 16.0 cm length and 12.2 cm girth for a long-term partner — a touch above the population average, not the wild extremes the internet obsesses over. We break the whole picture down in what women prefer.
Two findings deserve far more airtime than they get. First, girth mattered at least as much as length — arguably more — yet length hogs the entire cultural conversation. (We put the two head-to-head in girth vs length.) Second, and this is the one to sit with: most women report being satisfied with their partner’s size. The dissatisfaction in this whole topic runs overwhelmingly one direction — men worrying about themselves, not partners complaining. Whether size matters at all, and to whom, gets the full treatment in does size matter.
A practical aside: girth is also the number that decides whether condoms fit. If standard condoms feel tight or loose, that’s a girth-and-fit issue, not a verdict on your size — the condom size calculator sorts it out.
A note on age, countries, and other shaky numbers
Two categories of “data” deserve a hard side-eye.
Age: penis growth wraps up at the end of puberty, roughly 17 to 19. After that, adult size holds essentially steady for decades. So those charts plotting “average size by single year of adult age” — 5.4 inches at 31, 5.5 at 34 — are mostly invented. There’s no biological mechanism producing year-by-year adult changes, and no dataset granular enough to claim them anyway. We dig into the real picture in average penis size by age.
Country rankings: the viral maps ranking nations by size are almost entirely self-reported, not clinician-measured, and not drawn from representative samples. Self-reported numbers skew optimistic, and the sampling is whoever felt like submitting. Treat them as entertainment. Our average penis size by country page lays out why these figures collapse under scrutiny.
Finally, the genuinely clinical line. Micropenis is a specific medical definition — a bone-pressed stretched or erect length under about 9.3 cm — and it applies to roughly 0.6% of men, about 1 in 170. It’s rare, it’s defined, and it’s a conversation for a doctor, not a forum. Details in what is a micropenis.
FAQ
If the average is 13.12 cm and the median is 13.1 cm, which one should I compare myself to? Use the median and the percentiles — they tell you where you stand in the lineup, which is what you actually want to know. The mean is useful mainly as a sanity check: because it sits right next to the median here, you know the distribution is roughly symmetric, with no weird outlier skew. For a personal comparison, “what percentile am I” beats “am I above average” every time, and the calculator hands you the percentile directly.
Why do I measure smaller than the charts say I should be? Almost always a measurement-method mismatch. The studies use bone-pressed length (ruler pushed to the pubic bone); if you measure with the ruler resting on top of your fat pad, you’ll read 1 to 2 cm shorter. Measure bone-pressed before you compare — see how to measure. Time of day, temperature, and arousal level move the number too.
Is being below average something to worry about? No — and the math is the reason. “Average” isn’t a cutoff; on a bell curve, a large share of perfectly normal men sit below the mean by definition. About 90% of men fall between 10.4 and 15.9 cm, all of it normal range. The only size with a medical definition is micropenis (bone-pressed under ~9.3 cm, ~0.6% of men), and that’s a question for a doctor. Everything else is just where you happen to land on a very crowded, very narrow curve.